Using EBIT-margin trend for analysis
In this weeks post of the screener series we use EBIT-margin to analyze the performance of our for industry groups, Pharma, Construction, Fashion and Tech
Hello there,
(Scroll down for TL;DR)
In today’s post, we will cover the second metric in our screener, namely, EBIT-margin trend. We do this by calculating the trend for a company’s EBIT-margin over the last five years. It is to assess if a company can successfully convert revenue growth into increasing operational profits relative to revenue. The industries are: pharma, construction, fashion and tech.
In last week’s post, I explained our methodology regarding how we approach adjustments and consideration for noisy periods. Put briefly, we avoid adjusting as far as possible to ensure that you, the reader, can compare what is written in an annual report against the numbers that I share in this post.
With the screener, we are in Discovery mode, not precision accounting.
I also mentioned that the screener baseline of five-year (2020-2024) performance will disqualify companies that have a track record shorter than five years and that the baseline year can be negatively impacted by external events; our current baseline year of 2020 is a great example of this. If we adjusted for all eventualities, we would be creating a scenario that is only possible to explain with a lot of ifs, buts and what nots.
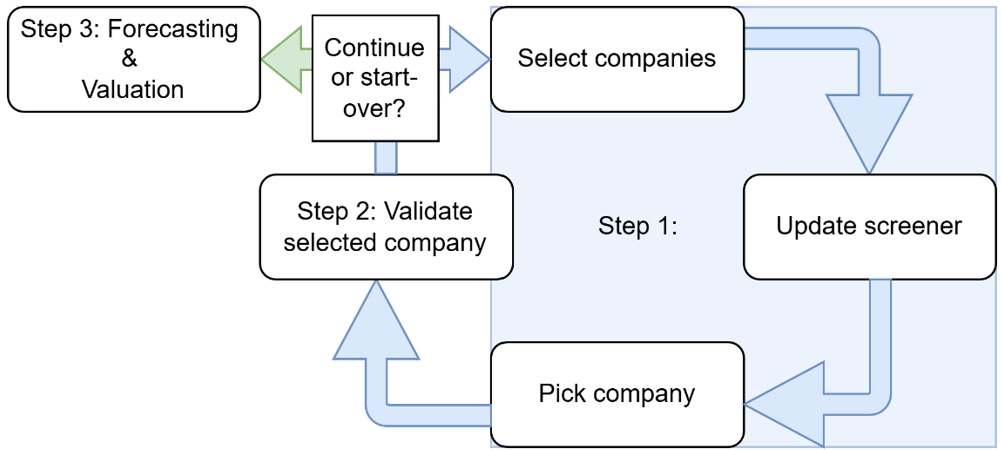
Remember, the screener is meant to be a tool that we keep using time and again as we look for new opportunities or assess old ones with new data. We will iterate through the first two steps, illustrated below, many times:
We are more focused on consistency in performance than short bursts of growth.
In this post, I will first present EBIT-margin alone and then combine it with revenue growth. Note that, last week, we only had revenue growth, but this week we will be able to see if the high-growth companies also succeed in defending or growing their EBIT-margin.
It is important to remember that we are now looking at a trend development. This means that companies that have a negative number see their EBIT-margins decline; an example of this would be: if a company’s 2020 EBIT-margin was 10%, and it decreased 8% in 2021, which gives us an EBIT-margin of 9.2%.
Pharmaceuticals
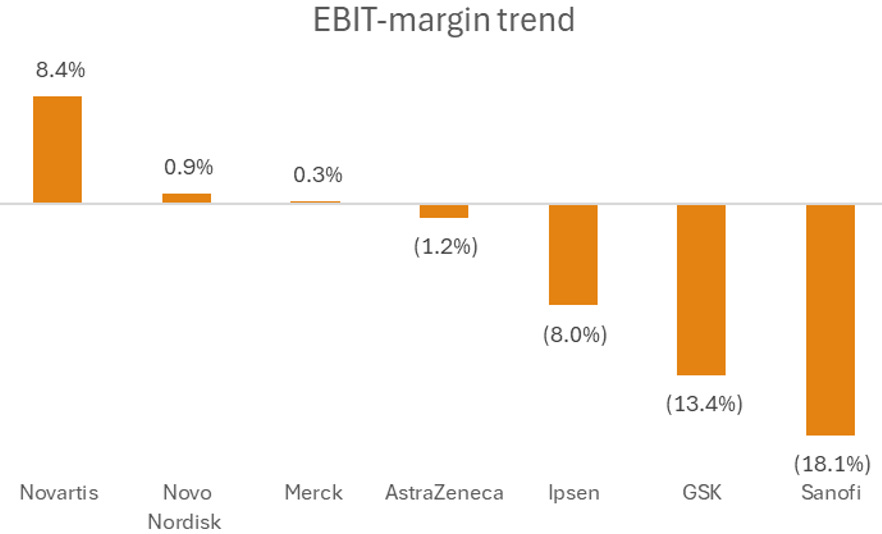
Last week, we could see the difference between introducing new treatments (GLP-1 for Novo Nordisk) and a weak pipeline (Novartis, Sanofi). This week, we will learn if the companies have been able to strengthen their margins with or without topline growth. In fact, the EBIT-margin trend between 2020-2024 for our pharma companies is quite revealing:
Novartis has done exceptionally well when it comes to growing their EBIT-margin, whereas Sanofi, GSK and Ipsen have performed poorly in this regard. It is, of course, pre-mature to celebrate Novartis, as the key issue remains how this will impact cash flow, but at least they have improved the possibility of a higher cash flow.
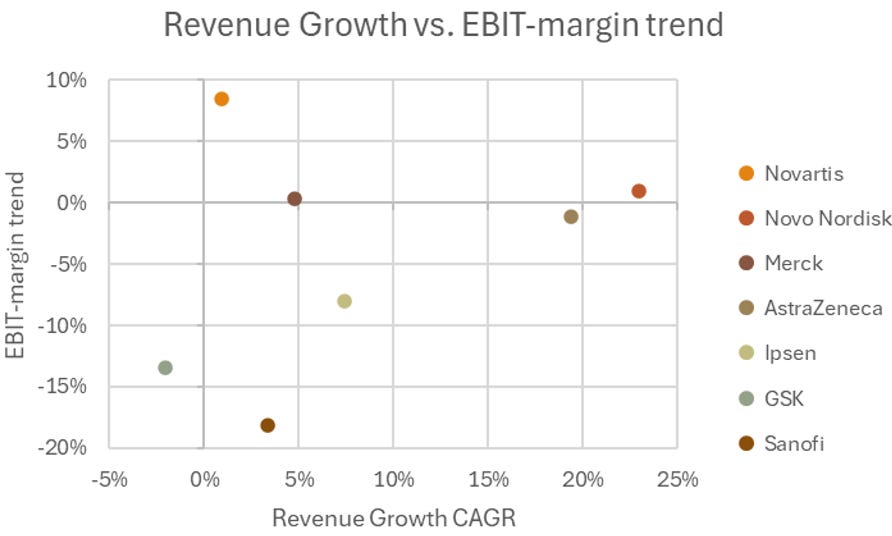
If we then look at how the companies performed across the two metrics, revenue growth and EBIT-margin, we get a very interesting picture indeed:
In the graph above, we have two standouts. First, Novartis has a strong EBIT-margin trend without much revenue growth, which typically indicates efficiency improvements in their cost base. This can be headcount reductions, supply chain optimization and so on. It can, of course, also be because they had a terrible 2020 but did nothing about it. ‘Step 2: Validation’ will focus on understanding and flagging oddities in the company’s performance. Second, Novo Nordisk stands out. They have succeeded in both growing their revenue immensely and defending their EBIT-margin, with a small positive trend. What then becomes interesting is if they have also succeeded in growing our upcoming metric: ROIC (Return On Invested Capital).
AstraZeneca and Merck have both managed revenue and EBIT-margin well over the five-year period. Ipsen and Sanofi are generating positive topline growth but are doing so at the expense of their margins. We may learn that they have strong ROIC and low PEG (price/earnings to growth ratio), which could compensate for this shortfall. But for now, it seems like Novo Nordisk and AstraZeneca have the lead on these two metrics.
It is concerning when a company is not only coming in short on revenue but is also having their margins decrease. For GSK, this typically means a period of uncertainty as they need to find their way back to stop this negative trend.
Investing in companies that are performing poorly with the hope that they are just around the corner for a turnaround is risky. Sometimes it can take years for a company to find the structural issues that have been holding them back, and for a pharmaceutical company it can come down to the patent portfolio simply not being strong enough, and then it can be ‘never’ before success is back.
This is why we are looking for consistency across several metrics, to avoid gambling on companies’ ability to turn themselves around.
Construction
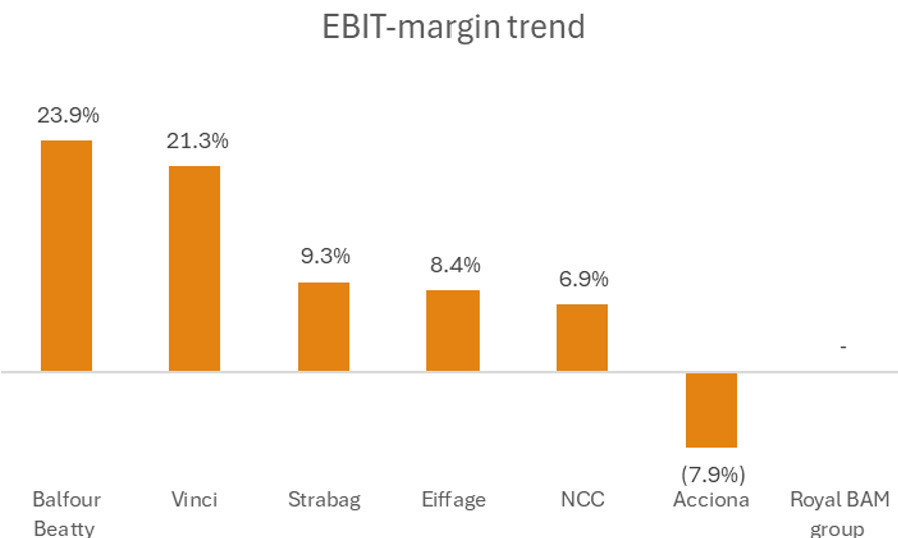
Last week, we saw the difference between construction companies that have diversified their portfolio (for example, Acciona and Vinci) and so-called pure-players (such as Royal BAM group and NCC). In the graph below, we can see how well either of them have managed to defend their EBIT-margins:
Note: Royal BAM group’s EBIT in 2020 was negative (-3.3%), and it is not possible to calculate a margin trend when the starting point is negative. In 2024, it was 0.9%.
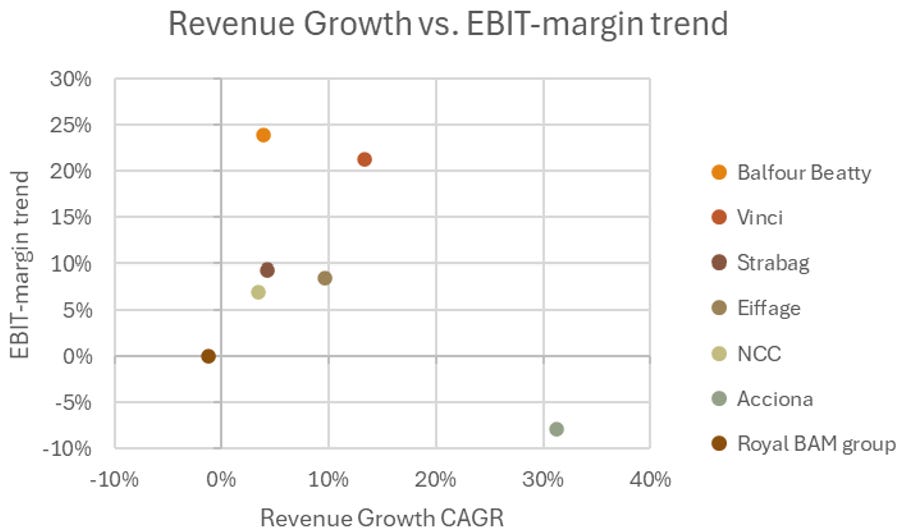
The graph above shows clearly the importance of excellence in execution when in an industry with large capital-intense projects. Only Acciona has seen their margins deteriorate over time, and they are the only ones that diversified into renewables, which have seen very aggressive price increases.
The graph below compares EBIT-margin trend with revenue growth:
We can see that having the highest growth is not all that matters. In 2020, Acciona had the highest EBIT-margin in the group but fell to third spot in 2024. If we think ahead to ‘Step 4: Peer Comparison’, this could be one of the changes that moves a company away from best in class, to being potentially value-destroying for their shareholders. That is not a stamp of quality for a management team.
Standout performance clearly belongs to Vinci, which has delivered both double-digit revenue growth and significantly expanded their margins over time. Balfour Beatty, on the other hand, has clearly succeeded in increasing how much they get from every Euro earned; however, they have a razor thin EBIT margin at 1.7% in 2024, which doesn’t leave the company with much flexibility.
As an industry, I find that the construction companies in our group manage their margins well, at least better than pharma. This is a necessity more than anything else, since if they had poor project execution and sloppy cost control, they would not be able to compete for projects: their pricing would simply make them uncompetitive or loss-making.
Fashion
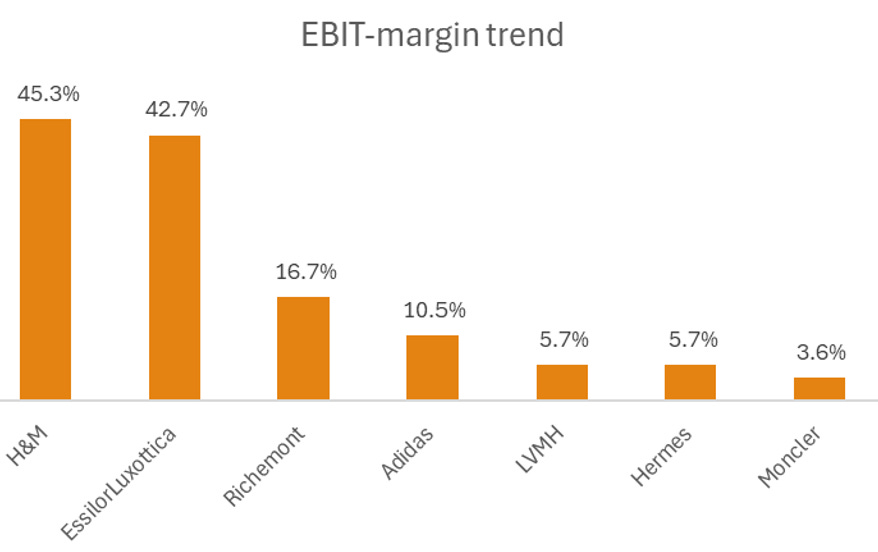
Next there’s Fashion, where we have an interesting mix of companies. The range from low-cost fast fashion to high-cost luxury products should be reflected in EBIT-margin trends and defensibility of margins. In the graph below, we can see that the top performers are not only luxury companies:
An interesting aspect of the fashion industry is that in 2020, almost all the companies in my sample recorded their lowest EBIT-margin. This coincides with significant decreases in their revenue between 2019-2020. We all know why: COVID-19.
It is situations like these that make people want to adjust their starting point, to 2019 or 2021. But to be fair, if we look for perfection, we risk paralyzing ourselves, since more often than not, we will not find it. It is better to find the company that is successful in managing its imperfections, especially through difficult times.
Let us now turn to a combination of EBIT-margin trend with revenue growth:
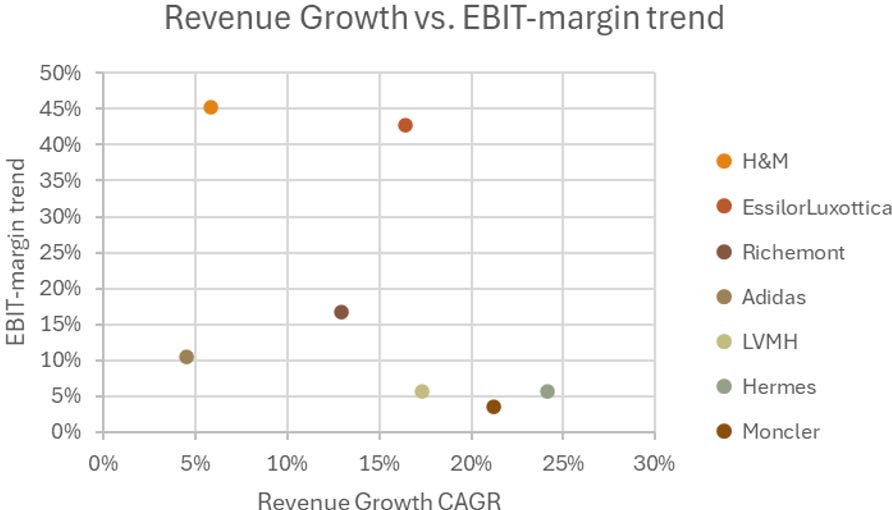
As we can see, all the companies have succeeded in improving their EBIT-margin over the last five years, albeit with varying degrees.
Note that EBIT-margin works more as an indication in the screener, and it is ROIC that will be the metric that we use to contrast revenue growth. This is because revenue growth and EBIT-margin are not sufficient to decide which companies to analyze more in-depth. In the case of this group, none would be disqualified on the basis of EBIT-margin alone.
What is worth pointing out is that Richemont saw its EBIT decrease 3.7% in 2020, while the rest of the companies had a decrease between 31% and 46%. But this is me distracting you with a single observation when we are, in fact, looking for patterns. The true picture emerges from having all the metrics together.
Tech
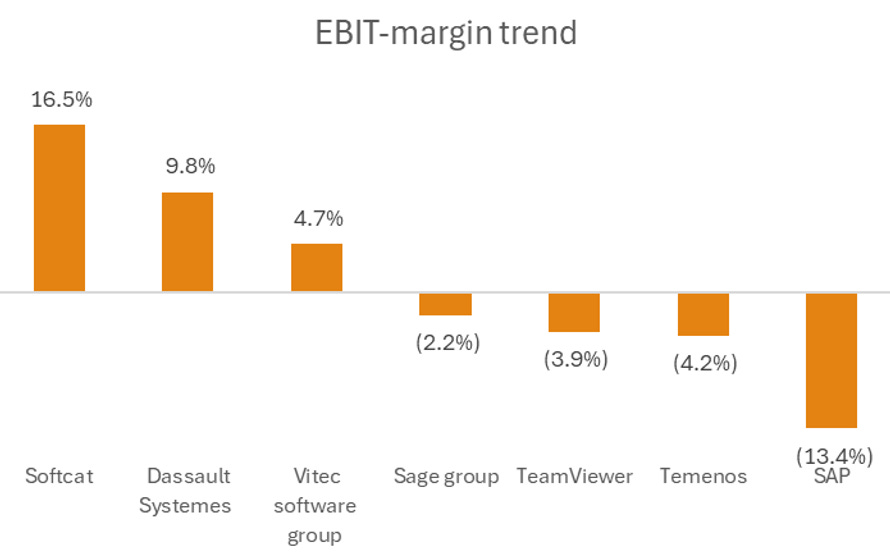
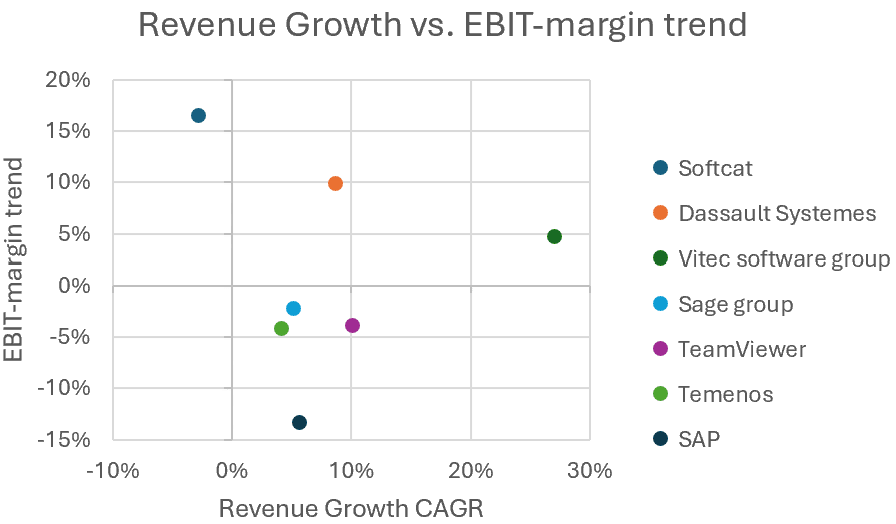
Last but not least, tech delivers a very mixed bag of results. In the graph below, we see outperformance by Softcat at 16.5% and underperformance by SAP at -13.4%.
SAP is interesting: last week I noted that their share price had developed pretty much in tandem with Nasdaq Composite index, which so far is not supported by our results in this screener. They have eroding margins and single-digit revenue growth, which usually is not the recipe for massive share price growth.
If we look at the combined results in the graph below, we can see that Vitec Software Group doesn’t just buy revenue year after year; they are also successfully keeping costs under control and expanding their margins:
Softcat is a great example of what can be expected when revenue starts declining and the company goes into transformation mode. Growing margins on a declining revenue requires companies to start changing their cost base. Softcast actually doubles their EBIT-margin in 2020-2024. This will make it an interesting case when we include the last two metrics, because then we will see if Softcat is also able to provide returns on their invested capital.
Tech as an industry is usually expected to have strong margins if their moat is defendable, but once past that, they will see their margins erode.
The four companies with decreasing margins (Sage Group, TeamViewer, Temenos, SAP) are most likely being challenged by new technology disrupting their offering. For instance, SAP is constantly challenged by new solutions, especially disruptors that develop solutions that challenge the idea of company-wide ERP.
Cross-comparison
The table below shows the results for all four industries:
It is interesting to note that the leaderboard has changed since last week, with many of the bottom-rated companies from revenue growth holding the top position in EBIT-margin trend. Here it is important to remind ourselves that when it comes to the EBIT-margin trend, we are only looking to see if it is improving, stable or declining in our screener.
As mentioned earlier, in a future post, revenue growth will be considered against ROIC, because it is that combination that shows how much value the company generates on its assets.
Wrapping up
This was EBIT-margin trend. In the coming weeks, we will see how adding more metrics (next up: PEG-ratio!) complements the view outlined in this post. As promised, the data are available here.
If you have any questions, comments or feedback in general, let me know in the comments!
PS! You can already try out FindItFinancials and start gathering your *own* data (soon with the screener built in).
Until next time!
//The Barn
TL;DR
FindItFinancials is now live! Access it here!
This week’s metric is EBIT-margin, showing if the companies can grow revenue and create value while maintaining their margins.
Pharma: Novartis leads EBIT-margin gains; Novo Nordisk excels overall, while Sanofi, GSK, and Ipsen lag.
Construction: Vinci grows margins; Acciona’s renewable pivot hits profitability.
Fashion: All our companies improved margins post-COVID-19, but luxury and fast fashion saw 2020 drops; deeper analysis is needed.
Tech: We get mixed results, where Softcat’s and Vitec’s margins are up, while SAP’s are down amid tech disruption; this suggests that strong margins rely on defending moats.
Next up: PEG-ratio!

